Every cold email that hits the spam folder is a meeting that never gets booked.
I track deliverability numbers obsessively because the difference between 85% and 95% inbox placement, across a 10,000-email campaign, is roughly 1,000 missed conversations.
The data below comes from primary research reports, platform telemetry, and community discussions. Not from other blog roundups. Every figure is sourced directly from the organization that produced it, and I have linked each source so you can verify it yourself.
Here is what the numbers actually look like in 2026.
If you are running cold outreach at scale, those numbers should frame every infrastructure decision you make. I will break them down category by category.
Understanding deliverability starts with understanding the environment your emails land in. The inbox is more crowded than it has ever been.
Daily email volume is at an all-time high. The Radicati Group's Email Statistics Report, 2024-2028 projects that 392.5 billion emails will be sent and received per day in 2026. That is up from 376.4 billion in 2025 and 361.6 billion in 2024. Growth sits at a consistent 4.1-4.3% year over year.
The number of email users worldwide topped 4.59 billion in 2025 and is projected to reach 4.73 billion in 2026. More than half the world population uses email, and that share continues to grow at roughly 3% annually. This is from the same Radicati Group report.
Nearly half of all email traffic is spam. Kaspersky's 2025 spam and phishing report, published on Securelist, found that 44.99% of global email traffic in 2025 was classified as spam. That translates to roughly 169-176 billion spam emails per day.
Malicious email attachments surged 15% year over year. Kaspersky's telemetry detected over 144 million malicious and potentially unwanted email attachments in 2025, a 15% increase from the prior year. This was reported in their official press release.
Russia, China, and the United States are the top three sources of outgoing spam. Russia accounts for 32.5% of global outgoing spam volume, followed by China at 19.1% and the US at 10.57%. These figures come directly from Kaspersky's Securelist annual report.
The implication for cold email senders is straightforward. ISPs are processing almost 200 billion spam messages every single day. Their filters are built for that scale. If your authentication, reputation, or sending patterns look even slightly off, you will get caught in the crossfire.
This is exactly why warming up your mailboxes before sending matters. Inbox providers need to see a positive engagement pattern before they trust your domain.
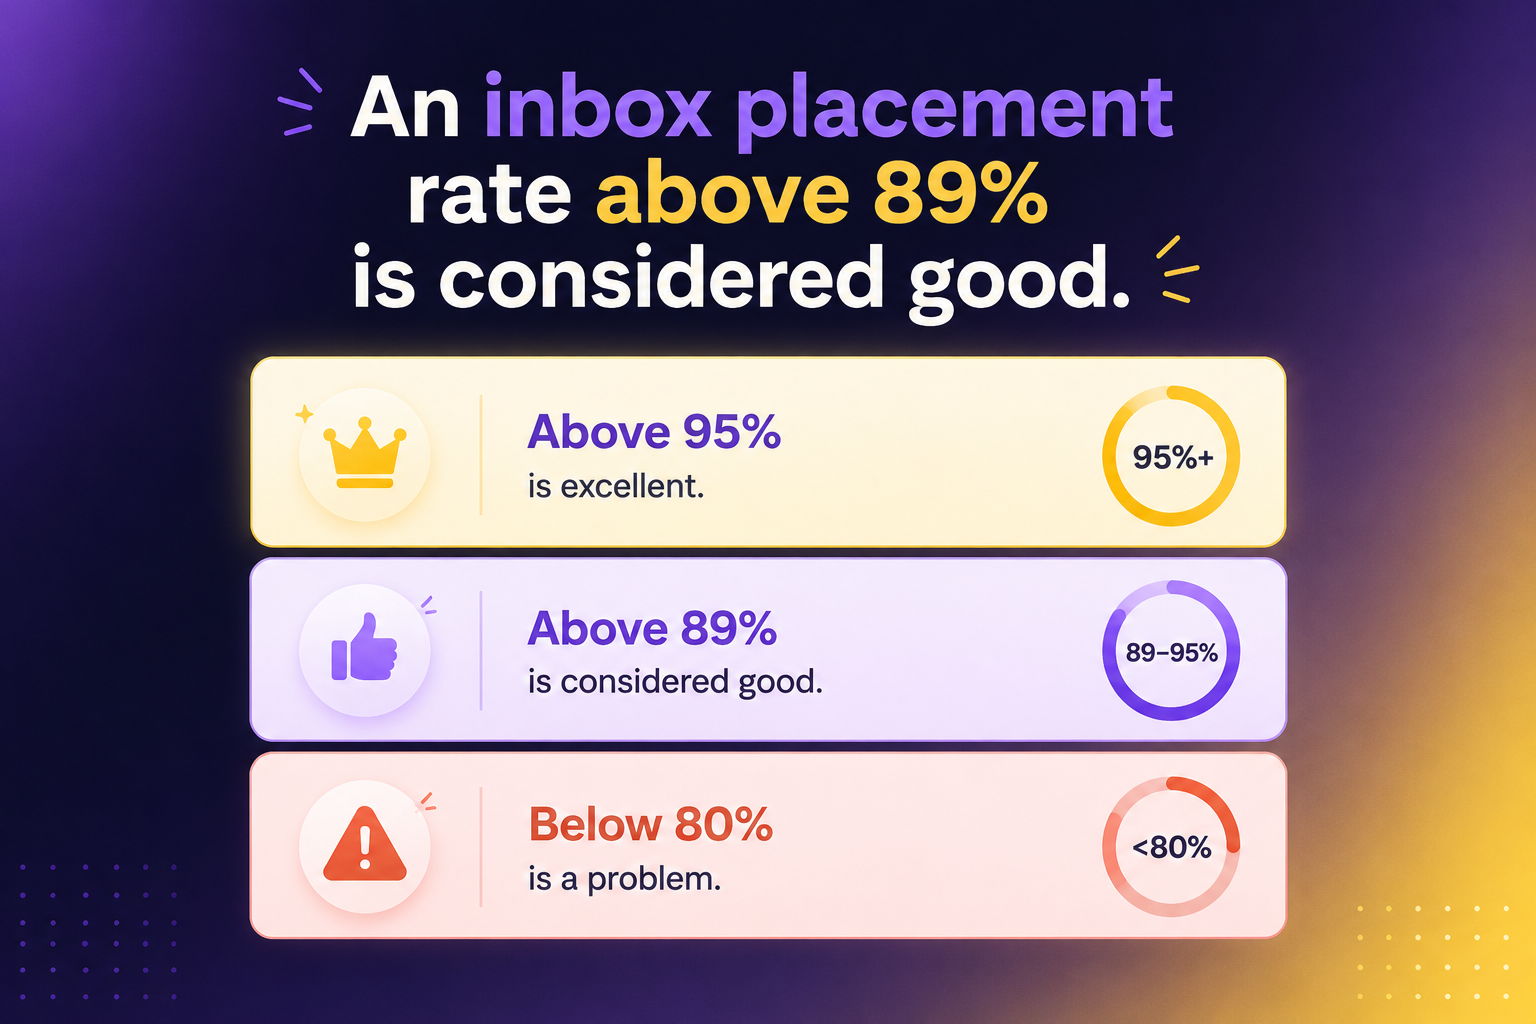
Inbox placement rate is the metric that actually matters. It measures what percentage of your emails reach the primary inbox, not just whether the server accepted them.
The average inbox placement rate across major ESPs is 83.1%. This is from EmailTooltester's ongoing deliverability benchmark, which tests 15 email service providers. That means 16.9% of legitimate emails never make it to the inbox.
Breaking that 16.9% down further:
The Unspam.email Deliverability Benchmark, which updates every 24 hours, paints a different picture. Their data, aggregated from thousands of daily deliverability tests across providers and industries, shows a global inbox placement rate of just 65%. The discrepancy exists because Unspam tests a broader range of senders, including cold outreach and transactional emails, not just established marketing programs.
The global deliverability health score, per Unspam, sits at 88 out of 100. That sounds great until you realize that health score measures your infrastructure setup, while inbox placement depends on a much larger set of variables, including content quality, engagement history, and provider-specific filters.
For cold email specifically, 2026 Cold Email Benchmark Report (which analyzed billions of interactions across thousands of workspaces) recommends targeting 80%+ inbox placement. Maintaining that requires proper warmup, authentication, consistent sending patterns, and monitoring.
If your inbox placement is dropping, the first place to check is your warmup and sender reputation. I have found that tools like Warmforge help diagnose the issue quickly because they track heat scores, inbox placement, and DNS health from a single dashboard. Without that visibility, you are guessing.
Not all inboxes are created equal. The provider your recipient uses has a dramatic impact on whether your email lands in the primary inbox.
Gmail leads with 87.2% inbox placement. According to Validity's 2026 Email Deliverability Benchmark Report, Gmail offers the best inbox placement rate among major providers and the lowest undelivered rate. However, that number dropped from 89.8% in early 2024 as bulk sender enforcement and engagement filtering tightened.
Microsoft Outlook has the lowest deliverability at 75.6%. The same Validity report shows that Outlook has the lowest inbox placement rate among all major email providers. Microsoft's Sweep functionality, which lets users bulk-move emails to secondary folders, contributes to this. If your cold emails target corporate Outlook inboxes (which is most B2B outreach), domain warmup and consistent engagement signals are non-negotiable.
Apple Mail shows 76.3% inbox placement, according to Validity data cited in a top deliverability analysis. Apple's Mail Privacy Protection (MPP) and Intelligence features now auto-summarize and categorize emails, making inbox placement increasingly dependent on trust signals rather than content.
Google, Microsoft, Yahoo, and Apple together process roughly 77-78% of all commercial email worldwide. This comes from both the EmailTooltester benchmark and the Validity report. Eight out of every ten emails your team sends will be processed by one of these four providers.
The gap between the best and worst providers is widening. Unspam.email's benchmark data shows a 77-point spread, from Amazon WorkMail at 100% inbox placement down to Yahoo at 23%. Treating deliverability as a single number is increasingly meaningless. You need per-provider visibility.
This is one of the reasons I recommend using real Google Workspace mailboxes for cold outreach to Gmail recipients and Microsoft 365 mailboxes for Outlook targets. Primeforge provides both, pre-configured for cold outreach with automated DNS and US IP addresses, ready in 30 minutes.
Your industry affects your inbox placement rate more than most senders realize. ISPs apply content-level heuristics and engagement patterns that vary by sector.
All industry-level data below comes from the Validity 2026 Email Deliverability Benchmark Report and Unspam.email's industry-segmented benchmark.
Mining has the highest email deliverability rate at 98%. This is from Validity's data. Healthcare, construction, and telecommunications follow closely, with rates between 88-95%.
Software and SaaS have one of the lowest deliverability rates at just 80.9%. Unspam's data aligns, showing Software and Tech at 72% inbox placement. Manufacturing and agriculture also sit at the bottom.
Education leads in Unspam's dataset at 80% inbox placement, likely because educational emails tend to have higher engagement rates and lower promotional intensity.
Health and Wellness is the most paradoxical sector. Unspam reports a health score of 89.7 (the highest of any industry), but inbox placement of only 59% (the lowest). These senders have the best technical infrastructure, but ISPs filter their content anyway because health-related keywords and offers trigger stricter rules.
B2B SaaS companies that monitor and maintain deliverability consistently hit 92%+ placement, according to the DigitalApplied 2026 benchmark report, which consolidates data from Validity, Litmus, Return Path, Postmark, and Google Postmaster Tools.
For SaaS and tech companies running outbound, the infrastructure you send from matters more than it does for other industries. Shared IP infrastructure through Mailforge gives you cost-effective sending at scale, while Infraforge provides dedicated IPs for high-volume senders who need full control over their sender reputation.
Where your recipients are located changes the game significantly.
The United States has an average email deliverability rate of 85%, according to Validity's regional data. Two factors drive this: extremely high email volume (nearly 9.7 billion emails per day domestically) and CAN-SPAM regulations.
Europe achieves 89.1% inbox placement. GDPR enforcement means European B2B email lists tend to be more accurate, and the lower volume per sender reduces ISP suspicion. This data comes from the same Validity regional analysis.
Germany hits 97.5%, while India sits at 71.0%. These figures, cited in Prospeo's deliverability data analysis (sourced from Validity), demonstrate how dramatically country-level variation affects results. If you are running global campaigns, segmenting your deliverability tracking by region is not optional.
Asia Pacific manages approximately 78% inbox placement, according to the Landbase analysis of Validity data.
If you are sending from US-based infrastructure to US recipients, starting with US-based IP addresses makes a noticeable difference. Primeforge mailboxes are sent from US IPs specifically for this reason.
Authentication is now the baseline for inbox access. Without SPF, DKIM, and DMARC, major ISPs will either reject or filter your emails outright.
SPF adoption reached 93% in 2026. DKIM hit 90%. These figures come from Unspam.email's real-time benchmark, up from 88% (SPF) and 84% (DKIM) the prior year.
Reverse DNS verification is at 99%. Almost all senders now have proper reverse DNS, per the same Unspam benchmark.
57.3% of B2B email senders now authenticate their emails, according to a report by Email Vendor Selection cited in the popular statistics roundup. This figure specifically measures authentication adoption among B2B bulk senders responding to Google and Microsoft's new requirements.
DMARC is where the real gap lies. Having SPF and DKIM is table stakes. DMARC enforcement is what separates trusted senders from everyone else.
Global DMARC adoption reached 52.1% across the top 1.8 million domains in early 2026, up from 47.7% in 2025 and 27.2% in 2023. This represents 937,931 domains with valid DMARC records. The data comes from EasyDMARC's 2026 DMARC Adoption and Enforcement Report.
However, 525,996 of those domains remain at p = none. That is more than half. A p=none policy provides zero protection against spoofing. It is in monitoring mode. It tells ISPs you are watching, but not enforcing.
Only 411,935 domains use enforcement-level policies (p=quarantine or p=reject), up from 233,249 in 2023. The growth is real, but the enforcement gap remains massive.
Fortune 500 companies lead in DMARC maturity: 95% adoption, over 80% at the enforcement level, and 62.7% at the strictest p=reject policy. This is from the same EasyDMARC report.
Inc. 5000 companies trail significantly: 76.2% adoption, but only 15.2% at p=reject, and more than half stuck at p=none. The maturity gap between large enterprises and high-growth companies is one of the clearest findings in the report.
Over 80% of domains globally still have no DMARC record at all or use a non-enforcing policy. And more than 70% of DMARC-enabled domains lack reporting (RUA) tags, meaning they have no visibility into who is sending email on their behalf. Both figures come from EasyDMARC's report.
DMARC adoption increased by more than 11% between 2023 and 2025, per Mailgun's State of Email Deliverability 2025 report, which surveyed 1,100+ senders globally.
2.3 million organizations adopted DMARC over the twelve months following Google and Yahoo's mandate, according to Red Sift, as cited in TechnologyChecker's analysis of DMARC adoption data.
The takeaway is straightforward. If you are running cold outreach and your domains do not have DMARC at p=quarantine or p=reject, you are actively hurting your deliverability. Every domain you set up through Mailforge or Infraforge gets automated SPF, DKIM, and DMARC configuration, which takes one variable off your plate entirely.
Bounces are a leading indicator of deliverability trouble. High bounce rates signal bad data to ISPs, and they respond by throttling or filtering your future sends.
The average cross-industry email bounce rate in 2026 is approximately 1.2% for well-maintained lists. This comes from Cleanlist's 2026 email deliverability benchmark analysis.
The average bounce rate for B2B emails specifically is 2.33%, according to Emma by Marigold, as cited in one of the popular statistics compilations. For B2B emails, a bounce rate under 2% is considered healthy.
B2B bounce rates run 0.7% higher than B2C due to faster data decay. Professional contacts change jobs, companies restructure, and corporate email systems update more frequently. This data comes from the Cleanlist benchmark.
Teams that verify emails in real time achieve 0.3% bounce rates and 95% inbox placement. Teams that never clean their lists see 6.5%+ bounces and lose nearly a third of emails to spam. This comparison comes from the same Cleanlist report.
B2B data decays at approximately 22.5% per year, with decay rates up to 70% in tech startups. This is from Cleanlist's analysis of data quality across industries.
Cold outreach specifically sees higher bounce rates. Snov.io's 2026 cold email statistics analysis, which examined their internal dataset of 10M+ emails, found that personalized cold emails showed a 2.55% bounce rate, while non-personalized emails showed 1.29%. Emails with attachments hit 2.98%.
The average bounce rate from popular cold email data is 7.5%. That is extremely high and indicates widespread list quality issues in cold outreach.
The pattern here is clear: cold email senders who skip list verification and domain warmup see bounce rates 3-5x higher than the industry benchmark. Warmforge's heat score monitoring catches reputation damage from bounces before it compounds.
Spam complaints carry disproportionate weight in ISP algorithms. Even a small number of complaints can tank your deliverability for weeks.
Google's threshold is 0.3%. Hitting that rate, just 3 complaints per 1,000 emails, triggers enforcement actions that can block your domain from reaching Gmail inboxes entirely. This is from Google's Email Sender Guidelines.
The recommended target is below 0.1%. Most high-performing senders aim for 0.1% or lower. The difference between 0.1% and 0.3% is the difference between "trusted sender" and "under review." This threshold comes from both Google's guidelines and Mailgun's State of Deliverability 2025.
48% of email senders say avoiding the spam folder is their biggest deliverability challenge. This is from Mailgun's survey of 1,100+ senders.
Including a one-click unsubscribe button decreases spam complaints by 35%, per Woodpecker data cited in ApolloTechnical's cold email analysis. And yet, 86% of tested emails are missing a List-Unsubscribe header, the one-click unsubscribe mechanism Gmail and Yahoo now require for bulk senders. This figure comes from Unspam. email benchmark.
That is the single biggest fixable gap in email deliverability right now. 48% of senders say spam is their top concern, and 86% of them are not implementing the easiest fix.
Cold email operates under a stricter set of rules than opt-in marketing email. ISPs know the difference, and they filter accordingly.
The average cold email reply rate is 3.43%. The 2026 Cold Email Benchmark Report, which analyzed billions of interactions, puts the platform-wide average at 3.43%, with top performers (top 10%) exceeding 10.7%.
58% of all cold email replies come from the first email. The remaining 42% come from follow-ups. The optimal sequence length is 4-7 touchpoints. This data is from the same Instantly benchmark.
Only 8.5% of cold outreach emails receive any reply at all, according to Backlinko's analysis of 12 million outreach emails.
A good deliverability rate for cold outreach is 95% or higher, per the data cited in Snov.io's analysis. Anything below that means your infrastructure, authentication, or list quality needs work.
Warming up a new email domain over 4-6 weeks before sending at full volume reduces spam placement by up to 35%, per Lemlist data cited in ApolloTechnical's statistics compilation.
Sending from a domain with a minimum 3-month history improves inbox placement by 28% compared to brand-new domains. This is from Woodpecker data cited in the same compilation.
Campaigns should start at 5-10 emails per day and gradually increase over 4-6 weeks. Sudden spikes in sending velocity trigger spam classification at major inbox providers. This recommendation comes from a popular benchmark report.
I have sent thousands of cold emails across different infrastructure setups, and the pattern is consistent: the teams that invest in proper domain warmup and ongoing monitoring outperform everyone else. Not by a small margin, but by 2-3x in reply rates. Warmforge handles warmup with a single click, tracks heat scores in real time, and runs placement tests across Gmail, Outlook, and other providers. It takes one variable and makes it automatic.
Some of the most important statistics in the 2026 landscape are not about deliverability rates. They are about how poorly senders understand their own metrics.
88% of senders cannot correctly define "delivery rate" versus "deliverability rate." Mailgun's survey found that 51% thought delivery rate measured inbox placement, and 23% thought it was an overall deliverability metric. Only 12% knew the correct definition: delivery rate measures the percentage of emails accepted by the receiving server, including those that land in spam.
Only 13% of senders use inbox placement testing to find out where their emails actually land. This is from the same Mailgun report. Seed testing is the most effective way to measure inbox placement, and almost nobody does it.
Only 49% of senders made changes to comply with Gmail and Yahoo's bulk sender requirements, per Mailgun's survey of 1,100+ senders. Despite requirements going into effect in February 2024, half of all senders have not adjusted.
23% of senders believe the new sender requirements from Gmail and Yahoo caused deliverability challenges, while nearly 64% of senders who were aware of the requirements believe they are necessary. This is from Mailgun's State of Deliverability 2025.
9.4% of senders admit to purchasing email lists or scraping the web for contacts in the last two years, per the same Mailgun survey. And among high-volume senders, the percentage is higher.
30% of email marketers do not actively monitor blacklist status, per data cited in one of the deliverability analyses, despite blocklisting causing immediate deliverability drops.
These numbers explain a lot. The reason average inbox placement is stuck in the low 80s is not a mystery. Most senders do not monitor their deliverability, do not test their inbox placement, and do not understand the difference between delivery and deliverability.
Warmforge's deliverability center addresses exactly this problem. It tracks heat scores, runs placement tests, checks SPF/DKIM/DMARC health, and monitors blacklist status from a single dashboard. The 14-day warmup process builds sender reputation before you start sending live campaigns.
The February 2024 bulk sender requirements from Gmail and Yahoo permanently changed the deliverability landscape. Microsoft followed with similar requirements in May 2025.
Bulk senders must now use both SPF and DKIM authentication, implement DMARC (minimum p=none), and support one-click unsubscribe (RFC 8058 List-Unsubscribe-Post header). These requirements apply to anyone sending 5,000+ daily emails to personal Gmail accounts. This is documented in Google's Email Sender Guidelines.
Gmail's enforcement escalation ramped up in November 2025, introducing permanent bulk sender classification. Non-compliant senders face temporary rate limiting or permanent rejection codes. This was reported in Prospeo's analysis of Validity data.
Among senders who made changes, nearly 80% updated their email authentication practices, per the State of Deliverability 2025.
The one-click unsubscribe header is the single most under-implemented requirement. Teams often add a visible unsubscribe link but omit the RFC 8058 List-Unsubscribe-Post header that Gmail specifically checks for. This was noted in the DigitalApplied benchmark report, citing Google Postmaster Tools data.
Microsoft has signaled similar bulk sender requirements for Outlook.com and Hotmail, expected to roll out in phases through 2026-2027. Apple iCloud Mail is expected to follow. This trajectory is documented in the same DigitalApplied report.
The 30%+ partial non-compliance rate two years after the requirements launched is the most consequential statistic in the 2026 report, per the DigitalApplied benchmark analysis. Partial compliance still produces measurable delivery penalties.
If you are setting up cold email infrastructure, automated authentication configuration removes this entire risk category. Mailforge and Infraforge both handle SPF, DKIM, and DMARC setup automatically during domain provisioning. You do not have to configure DNS records manually.
Authentication gets you in the door. Content quality determines whether you stay.
71% of emails fail basic HTML validation in 2026. Malformed tags, missing doctypes, and broken inline CSS all contribute. Poorly structured HTML triggers parsing-based spam filters.
42% of subject lines trigger at least minor spam flags. The usual triggers: aggressive urgency language ("Act Now," "100% Free," "Urgent"), ALL CAPS (2% of emails), emoji overuse (3%), and lines over 60 characters (7%). This is from the same Unspam benchmark.
91% of tested emails score under 3.0 on SpamAssassin, the general safe zone. The 9% above that threshold face increasingly aggressive filtering. Above 5.0, you are likely in spam. Above 10.0, you are blocked.
Only 56% of emails pass GDPR compliance checks, and just 8% pass CAN-SPAM compliance checks across Unspam's tested dataset. That is regulatory risk hiding in plain sight.
Emails under 100 words have a 50% higher engagement rate than longer ones, per Reply.io data cited in ApolloTechnical's compilation. For cold email specifically, the 2026 benchmark confirms that elite performers average fewer than 80 words per first-touch email.
Plain-text emails with minimal HTML avoid spam filters 30% more effectively than heavily formatted messages, per Smartlead data cited in the same ApolloTechnical compilation.
For cold outreach, plain text wins. Short emails win. Subject lines without spam trigger words win. The data is extremely consistent on this.
Deliverability is not just a technical metric. It is a revenue metric.
Email marketing delivers an average return of $36-42 per dollar spent in 2026, according to data from Litmus and DMA cited in the DigitalApplied email marketing statistics report. No other digital channel offers comparable returns at scale.
For a program generating $10 million in annual revenue, improving deliverability from 85% to 97% can mean up to $1.4 million in additional revenue. This calculation comes from Oracle Digital Experience Agency's deliverability analysis.
In the US and Canada, more than 20% of commercial emails do not reach subscribers' inboxes, per PowerDMARC's analysis of Validity data. That single metric represents billions in lost revenue annually across industries.
78.5% of senders rate email deliverability importance at 8/10 or higher, per Mailgun's 2025 survey. 46% gave it a solid 10 out of 10. But the gap between perceived importance and actual best-practice implementation remains enormous.
Companies that excel at email outreach generate 50% more sales-ready leads while cutting costs by one-third, per data cited in Martal's B2B cold email statistics compilation.
This is why I approach deliverability as an infrastructure problem, not a content problem. The right infrastructure, properly warmed and monitored through Warmforge, paired with clean domains from Mailforge or Infraforge and verified leads from Leadsforge, creates a system where good content can actually reach the people it is written for.
Industry reports give you averages. Community discussions give you the edge cases, the frustrations, and the real-world patterns that reports miss. I track several communities for this reason.
A thread in r/ActiveCampaign shared real performance data from their customer base and asked users to compare their open and click rates against 2026 benchmarks.
The thread reported the following figures based on campaigns sent between January 1, 2025 and December 10, 2025:
The thread also broke down open rates by industry. Top performers included Media/Publishing at 43.16%, Non-profit at 42.68%, Blogger/Author at 41.99%, Healthcare at 41.48%, and Travel/Hospitality at 40.87%.
For click rates, the top performers were Blogger/Author at 7.73%, Media/Publishing at 7.32%, Consulting/Agency at 7.05%, and Software at 6.67%.
The key takeaway from the thread: "Before obsessing over subject lines, the foundation is actually getting into the inbox. High deliverability means your emails actually reach people's inboxes instead of getting flagged as spam." Low open rates? Check your deliverability first. Authentication (SPF, DKIM, DMARC), list hygiene, and sender reputation come before copy optimization.
This is exactly what I see in practice. Most teams jump to subject line testing when the real problem is infrastructure. If your emails are not reaching the inbox, no subject line will fix that. Warmforge solves the foundation layer: warmup, heat score monitoring, placement testing, and DNS health checks.
These are opt-in marketing email numbers, not cold outreach. Cold email benchmarks are meaningfully different, which brings up the next community thread.
A HubSpot Community thread on cold email benchmarks captured this exact frustration. The original poster noted that searching for "cold email benchmarks" returns marketing email performance data, with some sources citing absurd figures like "anything over 60% open rate is considered good."
The accepted solution was telling: "For cold outreach, the consensus is that open rate is not a great metric to focus on. Instead, optimize for positive replies." The thread recommended building your own baseline from the first couple of sequences rather than chasing published averages. Multichannel sequencing (email plus LinkedIn) showed a 20%+ lift in engagement.
In a separate HubSpot Community thread on dedicated vs shared IPs, practitioners confirmed what the data shows. One contributor wrote that a dedicated IP "will not improve anything but likely make things worse" if the underlying problem is email behavior rather than IP reputation. The consensus: for B2B software companies sending under 100,000 emails per month, a shared IP is often the better choice as long as you maintain clean lists, segment audiences, and authenticate properly.
This maps directly to how the Forge infrastructure works. Mailforge provides shared IP infrastructure for cost-effective scaling. Infraforge provides dedicated IPs for high-volume senders who need full IP control. The community data suggests most teams should start with shared IPs and move to dedicated only when monthly volume exceeds 50,000-100,000, and they have the resources to manage IP reputation actively.
The Warmforge blog has documented that teams running consistent 5% reply rates on cold email share a common infrastructure setup: secondary domains (never the primary business domain), automated DNS configuration, 2-3 day follow-up spacing, bounce rates below 1%, and continuous warmup even during active campaigns. This is from Warmforge's Cold Email Deliverability Guide.
The "delivery rate vs. deliverability rate" confusion that Mailgun documented (88% of senders get it wrong) shows up constantly in community discussions. Senders celebrate 99% delivery rates without realizing their emails are being "delivered" to the spam folder. This is why inbox placement testing, like the placement tests available in Warmforge, matters more than any delivery rate metric your ESP shows you.
Practitioners consistently report that Microsoft/Outlook is the hardest provider to reach. Even teams with perfect authentication struggle on Outlook, especially since Microsoft tightened its filtering in May 2025 with requirements for senders of 5,000+ daily messages. This aligns with Validity's data showing Outlook at 75.6% inbox placement, the lowest of any major provider.
A good email deliverability rate falls between 95% and 99%, according to PowerDMARC's analysis of industry benchmarks. An inbox placement rate above 89% is considered good per EmailTooltester's benchmark, while above 95% is considered excellent. Anything below 80% indicates a serious problem with sender reputation, authentication, or list hygiene that needs immediate attention.
Delivery rate measures the percentage of emails accepted by the receiving mail server. An email "delivered" to the spam folder still counts as delivered. Deliverability rate (inbox placement rate) measures the percentage that actually reaches the primary inbox. Only 12% of senders correctly understand this distinction, per Mailgun's 2025 survey of 1,100+ senders. The difference is critical because a 99% delivery rate with 65% inbox placement means a third of your emails are landing in spam.
Cold email inbox placement varies widely depending on infrastructure quality. The global average across all email types is 83.1% per EmailTooltester, but Unspam.email's broader benchmark (which includes cold outreach) shows just 65%. Top-performing cold email senders achieve 90%+ by using proper domain warmup, authentication, and list verification. Tools like Warmforge help bridge this gap through automated warmup and real-time placement monitoring.
Significantly. EasyDMARC's 2026 report shows that only 52.1% of the top 1.8 million domains have DMARC, and more than half of those use p=none (monitoring only). Countries with mandatory DMARC requirements, like the US with BOD 18-01 for federal agencies, saw phishing delivery rates drop from 69% to 14% per EasyDMARC's 2025 report. For cold email senders, DMARC at p=quarantine or p=reject is effectively mandatory for consistent inbox placement.
The recommended warmup period is a minimum of 14 days, with many practitioners recommending 2-4 weeks. Start at 5-10 emails per day and gradually increase over 4-6 weeks, per 2026 benchmark recommendations. Sending from a domain with at least 3 months of history improves inbox placement by 28% compared to brand-new domains. Warmforge automates this process with an AI-driven warmup that mimics human sending behavior, and you can start with 1 free Google/Microsoft warming slot.
The cross-industry average bounce rate in 2026 is 1.2% for well-maintained lists, per Cleanlist's benchmark data. For B2B emails specifically, keeping it under 2% is considered healthy. Google's bulk sender guidelines recommend staying under 2%, and anything above 3% signals a serious data quality issue. For cold outreach, I recommend keeping bounce rates below 1% and pausing campaigns immediately if they spike above 3%.
Microsoft Outlook shows just 75.6% inbox placement, the lowest among major providers, per Validity's 2026 Benchmark Report. This is partly due to Outlook's Sweep functionality (which bulk-moves emails to secondary folders) and its Focused Inbox feature (which deprioritizes messages from low-engagement senders). Microsoft also announced bulk sender requirements in May 2025 for senders of 5,000+ daily messages, adding another enforcement layer. For B2B outreach targeting Outlook inboxes, using real Microsoft 365 mailboxes from Primeforge and maintaining strong engagement signals is the best approach.